From Shore To Sea: Comparing Microplastic Properties Between Shallow And Deep Waters
The paper discusses the global issue of marine plastic pollution, specifically focusing on the distribution of microplastics in the ocean’s subsurface layers. It synthesizes data from 1,885 sampling stations collected between 2014 and 2024, revealing that microplastics are found throughout the water column with varying abundance by size and depth. The study highlights significant uncertainties in current measurement methods, which complicate understanding the true extent and impact of microplastics on marine ecosystems. It emphasizes the need for standardized research approaches to improve knowledge of microplastics distribution and its ecological consequences.
Citation: The Following Is An Unpublished ‘News And Views’ Style Discussion Written By Shradha Mukherjee For General Audience About “Zhao, S., Kvale, K.F., Zhu, L. et al. The distribution of subsurface microplastics in the ocean. Nature 641, 51–61 (2025). https://doi.org/10.1038/s41586-025-08818-1“
Contents
- Title
1.1 Keywords
1.2 Summary - Introduction
2.1 Scientific Context
2.2 Microplastic Studies: Sources of Errors and Mitigation Strategies - Methods
3.1 Methods: Standards in the context of this study
3.2 Methods: Data Collection and Comparison Groups
3.3 Methods: Analysis - Results and Inference
4.1 (From Figure 1 of original paper) Globally, floating and subsurface microplastic, are more concentrated in mid-latitude. The concentration of microplastic is more nearshore and decline with depth is more pronounced, i.e. near the source of plastic production than offshore.
4.2 (From Figure 2 of original paper) In open ocean or offshore, large microplastic (>100 μm) are more trapped by pycnoclines and subsurface zones, while small microplastic (<100 μm) are more uniformly distributed.
4.3 (From Figure 3 of original paper) More dense microplastic nearshore, while buoyand microplastic is equally distributed nearshore and offshore. Chemically, polypropylene is more abundant nearshore, while polyester, polyamide and polyethylene are more abundant offshore. - Discussion
5.1 Zhao et al 2025 Study: Data Collection, Analysis, and Interpretation
5.2 Utilizing Research Findings 5.3 Challenges and Recommendations
5.3.1 Standardization challenges in microplastic datasets 5.3.2 Statistical and Computation fixes for sampling artifact or non-standard microplastic datasets
5.3.3 When using statistical and computational fixes, its important to make sure real ecological differences are not removed as sampling artifact - References
1. Title
From Shore To Sea: Comparing Microplastic Properties Between Shallow And Deep Waters.
1.1 Keywords
Marine plastic pollution, microplastics, ecology, lifespan of microplastics, microplastics in water column, need for standardized microplastics research.
1.2 Summary
The paper discusses the global issue of marine plastic pollution, particularly focusing on the distribution of microplastics in the ocean’s subsurface layers, which are often overlooked in research. It synthesizes data from 1,885 sampling stations collected between 2014 and 2024, revealing that microplastics are found throughout the water column, with their abundance varying by size and depth. Smaller microplastics tend to be more evenly distributed and have a longer lifespan, while larger ones accumulate in specific layers. The study highlights significant uncertainties in current measurement methods, which complicate understanding the true extent and impact of microplastics on marine ecosystems. It emphasizes the need for standardized research approaches to improve knowledge of microplastic distribution and its ecological consequences.
2. Introduction
2.1 Scientific Context [Ref: Landrigan et al 2020, Li et al 2025]
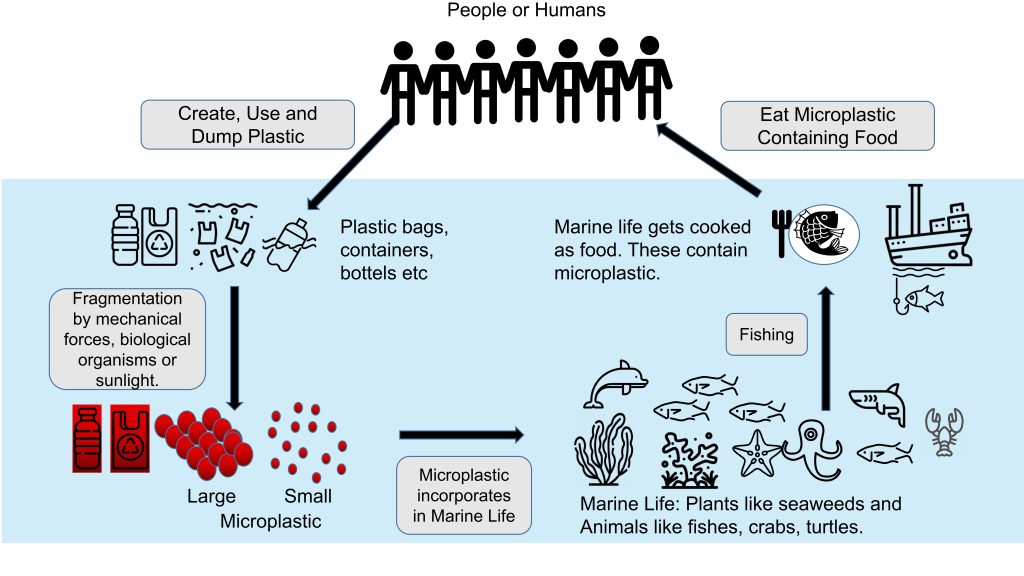
Microplastics, defined as plastic fragments smaller than 5 mm, represent a significant environmental challenge due to their pervasive presence in marine ecosystems. These particles originate from various sources, including industrial and domestic wastewater, fishing gear, shipwrecks, and plastic debris on beaches. Once introduced into the marine environment, microplastics interact with organisms and ecosystems through ingestion, entanglement, and physical contact. These interactions can result in adverse effects, such as reduced growth rates, altered behaviors, and mortality in marine species. For humans, microplastics enter the food chain through seafood consumption or contaminated water, potentially contributing to health issues such as reproductive disorders, immune dysfunction, and increased cancer risks.
Addressing microplastic pollution requires a multi-faceted approach. Reducing single-use plastics is a critical step, achievable through consumer education and government policies, such as bans on specific plastic packaging or taxes on disposable items. Improving waste management systems, including enhanced recycling programs and better waste segregation, can prevent microplastics from entering the environment. Additionally, promoting the development of biodegradable materials offers a sustainable alternative to traditional plastics. Public awareness campaigns play a vital role in educating communities about the consequences of plastic pollution and encouraging lifestyle changes. Finally, international cooperation is essential for sharing knowledge, resources, and best practices to combat plastic waste on a global scale.
2.2 Microplastic Studies: Sources of Errors and Mitigation Strategies [Ref: Nyadjro et al 2023, She et al 2022]
Research on microplastics, such as the study by Zhao et al 2025 on subsurface microplastic distribution, provides valuable insights into this global issue. However, scientific studies are often constrained by limitations and potential errors. Common sources of error in microplastic research include sampling biases, instrumental inaccuracies, data handling mistakes, modeling assumptions, and a lack of standardization. Sampling biases may arise from the selection of specific locations or times, which might not represent broader conditions. Instrumental errors, such as equipment malfunctions or calibration issues, can compromise measurement accuracy. Data handling errors, including incorrect formatting or data loss, further complicate analysis. Additionally, mathematical models often rely on assumptions that may not fully reflect real-world conditions, leading to biased results. The absence of standardized protocols for sampling and reporting exacerbates inconsistencies across studies.
To address these challenges, researchers have developed mitigation strategies. Standardized sampling protocols ensure consistent data collection across studies, while regular calibration and maintenance of equipment minimize instrumental errors. Implementing robust data quality control measures, such as validation and verification processes, helps detect and correct handling errors. Validating models against empirical data and employing alternative methods can reduce the impact of flawed assumptions. Interdisciplinary collaboration fosters the exchange of best practices and promotes standardization, enhancing the reliability of findings.
3. Methods
3.1 Methods: Standards in the context of this study
International System of Units, for scientific research across fields will make it more reproducible. However, for offshore vs nearshore, for large vs small microplastics, there are no international standards. So the authors, created certain internal standards to define groups for comparison, but not necessarily for all studies in scientific literature. This has to be done as there are no absolute standards. Example μm represents a specific length internationally, but how many μm make large or small microplastic does not have international standards, so authors need to define this.
In the context of the author’s datasets, microplastics are categorized as small (<100 μm) and large (>100 μm), with a quadratic relationship between settling velocity and size. In the paper, authors focus on larger microplastic more than small microplastic, because small microplastics have similar velocities and are less influenced by density layers, while large microplastics are affected by wind-driven currents and buoyancy.
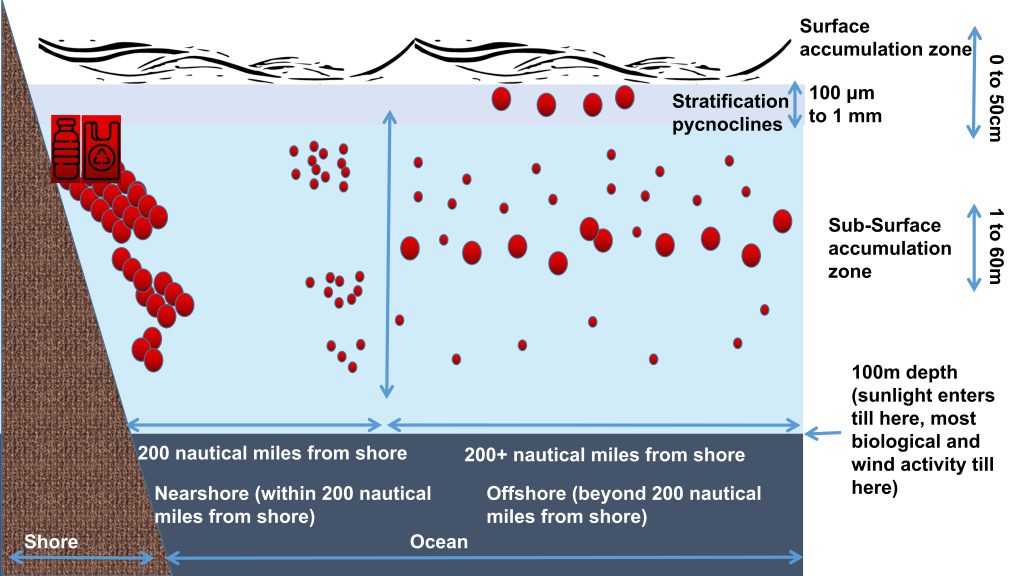
For horizontal location, the authors compare microplastic near shore and offshore (open ocean) groups. The authors, define nearshore as within 200 nautical miles from shore, and offshore or open ocean as beyond 200 nautical miles from shore.
In the context of the author’s datasets, for vertical location, the authors compare above and below 100 m depth, where subsurface microplastic accumulation zone was at 1–60 m depth and surface accumulation zone was at 0-50 cm depth. This 100 m depth is significant because it marks the lower boundary of the sunlit (euphotic) zone and aligns with the level where the majority of wind-driven mixing occurs. Often used as a reference point for measuring the particulate organic carbon (POC) flux from the ocean’s biological carbon pump, the 100 m depth also separates regions with markedly different rates of organic particle consumption. Since biological processes are a primary mechanism driving microplastic transport in the ocean, using 100 m as a dividing line allows for a clearer comparison of microplastic quantities while accounting for variations in biological activity.
3.2 Methods: Data Collection and Comparison Groups
Subsurface microplastic data were identified using a Web of Science search pattern. Studies with specific depths and spectroscopy-based identification were included, while those lacking detailed methods or relying solely on optical microscopy were excluded. Data from eligible studies were compiled in a spreadsheet, with missing data retrieved using WebPlotDigitizer or by contacting authors, and the dataset is publicly available.
3.3 Methods: Analysis
Authors used Generalized Additive Models (GAMs) to study microplastic abundances in near-surface waters (1–60 m) and floating microplastic levels along latitude. A GAM is a statistical tool that extends linear regression by allowing relationships betauthorsen variables to be non-linear. It uses smooth curves instead of straight lines to better fit complex data patterns. For example, instead of assuming a straight-line relationship betauthorsen latitude and microplastic abundance, GAMs can model curves that reflect real-world trends.
To measure prediction uncertainty, authors applied a Monte Carlo simulation, which works like rolling a pair of dice repeatedly to see all the possible outcomes. In this case, authors ‘rolled the dice’ 1,000 times by resampling the data with replacement. For each roll, authors fitted a GAM and predicted microplastic density at 1,000 latitude points, creating a range of possible results for each latitude. Imagine this as plotting the results of all the dice rolls to see the most common outcomes and how much they vary. From this, authors calculated the mean (the average roll) and standard deviation (how far the rolls typically are from the average) to understand central tendencies and uncertainties. This approach helps us visualize how predictions might shift under different scenarios, much like seeing the spread of outcomes from rolling dice repeatedly, often represented in graphs or plots.
Authors also developed a vertical model to replicate how plastic debris is distributed with water depth. Unlike a simple regression plot, which assumes a linear relationship between microplastic abundance and depth, this model uses a mathematical equation derived from a log-log plot of observed microplastic abundances against depth. The log-log approach better captures the non-linear patterns in the data, allowing for more accurate predictions of how microplastic concentration decreases with increasing depth. The equation calculates microplastic abundance as a function of depth, where the slope and intercept of the regression line (parameters a and b) describe how abundance changes with depth. Essentially, this model predicts how plastic concentration decreases as you go deeper into the water column.
Many statistical tests assume a normal distribution, like a bell curve where most data points cluster around the average, with fewer points further from the center. A normal distribution means symmetry and a predictable spread of data around the mean. Variance measures how far data points spread from the mean, showing the variability within a dataset. Equal variance, or homoscedasticity, means the spread of data points is consistent across groups being compared. Variance is different from error. Variance describes the natural spread, while error is the difference between observed and predicted values in a model. Microplastic abundance data often deviates from this pattern due to variability in sources (e.g., clothing, packaging, industrial processes), environmental differences (oceans, rivers, urban areas), inconsistent sampling methods, and outliers. These factors cause irregular distribution in microplastic data. Since the microplastic datasets didn’t follow a normal distribution (Kolmogorov–Smirnov test) and showed unequal variances (Levene’s test), authors used the Kruskal–Wallis test, a non-parametric alternative to ANOVA, for comparisons. Significant differences were followed by pairwise Mann–Whitney–Wilcoxon tests, with p-values below 0.05 considered statistically significant.
Authors conducted all analyses using R software (v.3.4.3) and relied on the mgcv, MASS, and boot packages for GAM fitting, Monte Carlo simulations, and bootstrap analysis. Visualizations, such as plots and graphs, were created to illustrate the results and provide a clear understanding of the findings. The ggplot2 package is a package with advanced plotting capabilities, its unclear what the authors specifically used for their plots.
4. Results and Inference
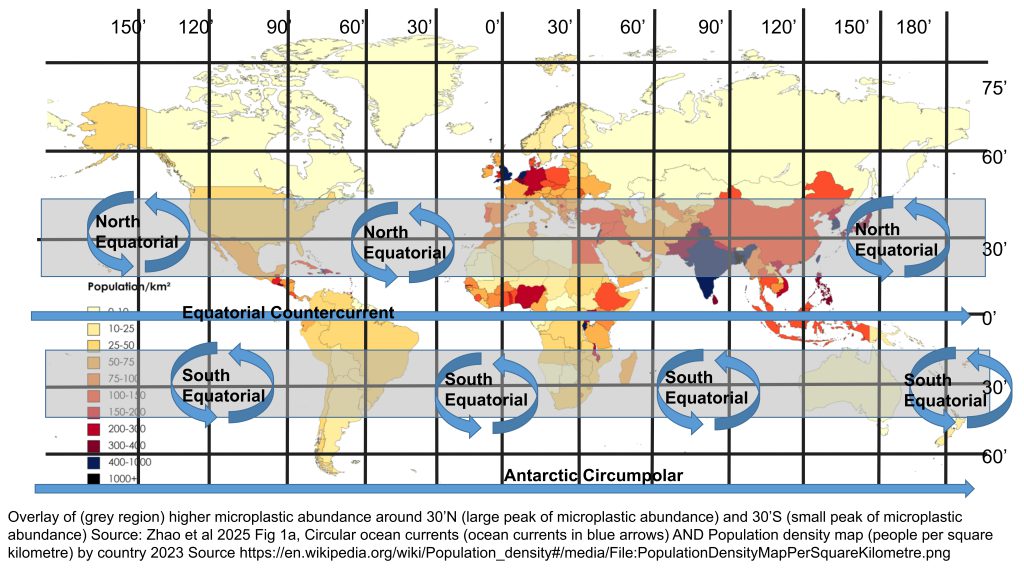
4.1 (From Figure 1 of original paper) Globally, floating and subsurface microplastic, are more concentrated in mid-latitude. The concentration of microplastic is more nearshore and decline with depth is more pronounced, i.e. near the source of plastic production than offshore.
The research presents a comprehensive analysis of microplastic distribution around the world. It shows that nearshore waters tend to have higher concentrations of microplastics compared to offshore environments, approximately 100 – 100,000 particles per m3 and 0.1 – 10,000 particles per m3 , respectively. This is likely due to the proximity of nearshore areas to land-based sources of microplastics and region of maximum human activity. The data also shows that microplastic abundance is maximum in mid-latitudes, which is also region of northern and southern circular ocean currents. Though, the authors call it ‘subsurface’ global distribution, it includes floating, subsurface microplastic and ocean floor (sediment trap) dataset visualization, albeit the sample size for ocean floor sample is small only 13, so not very significant compared to floating and subsurface thousands of samples. The authors, then compared change in abundance with depth for nearshore and offshore large microplastic using GAM and Monte Carlo simulation, which revealed microplastic abundance decreases with increasing water depth. This depth-based decline in microplastic levels is more pronounced in the nearshore regions compared to the offshore or open ocean. The sharp decline in microplastic presence in coastal waters is likely due to high mineral and biological activity, which increases the sinking rates of aggregated microplastics. Diatoms, which are abundant in these ecosystems, contribute siliceous frustules that enhance the weight of microplastics, promoting their sinking. Additionally, calcite precipitates found on biofouled microplastics further increase their density, facilitating their vertical transport in nearshore waters. Overall, the findings highlight how microplastics, especially large microplastics are distributed globally at surface and subsurface, with higher concentrations closer to shore, closer to the surface of the water and closer to mid-latitudes.
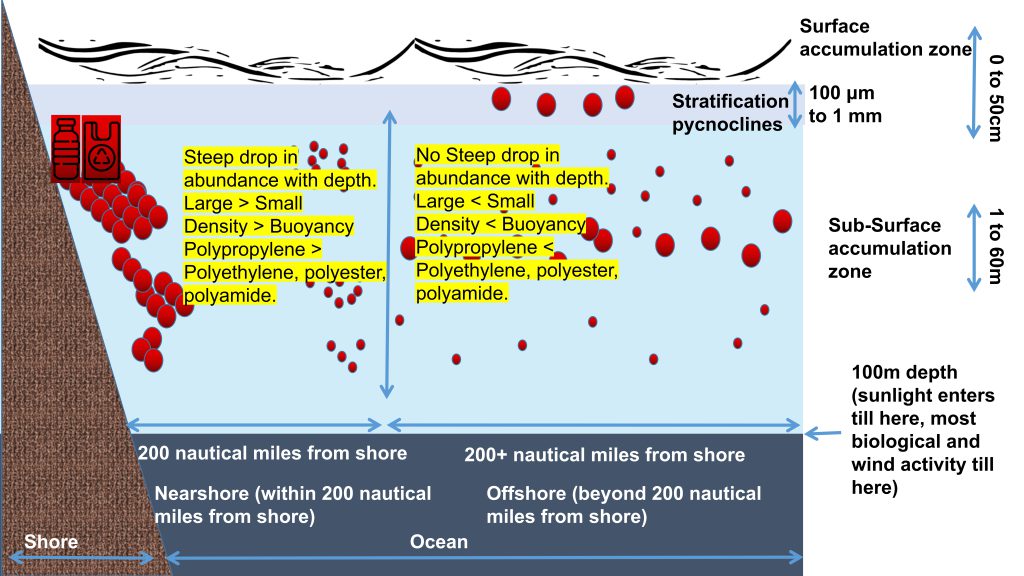
4.2 (From Figure 2 of original paper) In open ocean or offshore, large microplastic (>100 μm) are more trapped by pycnoclines and subsurface zones, while small microplastic (<100 μm) are more uniformly distributed.
The research explores the vertical distribution of microplastics in relation to pycnoclines, which are density-stratified layers in the water column. Vertical density stratification in the ocean, caused by temperature and salinity gradients, creates pycnoclines where water density changes sharply. These layers are often associated with high biological activity and increased particle concentrations, such as marine snow. The stratification length of pycnoclines refers to the vertical distance over which there is a significant change in water density within these layers. In the context of pycnoclines, this length can vary but typically ranges from about 100 μm to 1 mm, which is within surface accumulation zone at 0-50 cm depth in the context of this study. Scatter plot of abundance ratios of microplastics within and outside the pycnoclines, showed large microplastics, which are (>100 μm) are in range of pycnoclines length, were shown to be more trapped in it than small microplastics (<100 μm), smaller microplastic are more evenly distributed throughout the water column. This observation that large microplastics are more abundant in these pycnocline layers, is likely because stratification affects particle settling through buoyancy, diffusion, and viscosity, which increases drag and slows sinking for particles larger than the stratification length scale (ranging from 100 μm to 1 mm), while smaller particles like microplastics remain largely unaffected as they are out of range. The bar plot of microplastic within accumulation zone 1–60 m depth and outside of accumulation zone in offshore regions, showed higher concentrations of large microplastics are observed within the accumulation zones; albeit small microplastic show more overall abundance than large microplastic. Overall, vertical distribution of large microplastics and small microplastic in surface especially in pycnoclines and below surface in accumulation zone is shown.
4.3 (From Figure 3 of original paper) More dense microplastic nearshore, while buoyant microplastic is equally distributed nearshore and offshore. Chemically, polypropylene is more abundant nearshore, while polyester, polyamide and polyethylene are more abundant offshore.
The research here compares physical properties and chemical properties of microplastic found nearshore and offshore. Density is defined as mass per unit volume. It is a measure of how much matter is packed into a given space. Different materials have different densities. For example, lead is denser than aluminum, which is denser than water. Buoyancy, on the other hand, refers to the upward force that a fluid exerts on an object placed in it. This force is what allows objects to float or sink in a fluid. The principle of buoyancy is often explained by Archimedes’ principle, which states that an object submerged in a fluid experiences a buoyant force equal to the weight of the fluid displaced by the object. An object will float if its density is less than the density of the fluid, and it will sink if its density is greater. For example, a wooden block will float on water because its density is less than that of water, while a rock will sink because its density is greater. Box plots of buoyant and dense microplastics in nearshore and offshore waters, show nearshore regions have higher proportions of dense polymers. Box plots of chemical proportion of microplastic, shows polypropylene is more abundant nearshore, while polyethylene, polyester and polyamide are more abundant offshore. The comparison between buoyant and dense microplastics highlights the impacts of plastic properties on their transport and distribution in the water column. This information is crucial for developing better models to accurately predict the movement and fate of different types of microplastics. The varied compositions of polymers observed in both nearshore and offshore regions suggest various sources and pathways of plastic pollution. There are significant differences in the relative proportions of certain polymer types found in nearshore and offshore areas.
5. Discussion
5.1 Zhao et al 2025 Study: Data Collection, Analysis, and Interpretation
The Zhao et al 2025 study employs a comprehensive approach to analyze microplastic distribution, combining standardized sampling, advanced instrumentation, and statistical modeling. Water samples are collected from various depths and locations using sediment traps and optical instruments. Statistical methods, including regression analysis and Monte Carlo simulations, are applied to interpret the data, while computational models simulate microplastic behavior under different environmental conditions. Data visualization techniques effectively communicate the results, highlighting variations in microplastic concentrations across depths and regions. The study distinguishes between actual differences in microplastic distribution and artifacts caused by methodological errors, ensuring accurate interpretation of findings.
5.2 Utilizing Research Findings [Ref: Zhao et al 2025, Landrigan et al 2020, Li et al 2025]
Microplastics are distributed throughout the ocean, with higher concentrations observed at specific depths. Smaller particles exhibit more uniform distribution, whereas larger fragments tend to accumulate near the surface. External factors, such as biological processes and oceanic dynamics, influence the vertical transport of microplastics. These findings underscore the ecological risks posed by microplastics, including disruptions to food webs and threats to marine biodiversity. As microplastics enter the food chain, they may also pose significant health risks to humans. The study highlights the urgent need for increased awareness and action to address plastic pollution. The findings from microplastic studies can inform policy development aimed at reducing plastic usage and improving waste management practices. Understanding microplastic behavior can inspire the creation of environmentally friendly materials and biodegradation technologies. Additionally, community initiatives and international cooperation are crucial for mitigating plastic pollution and protecting marine ecosystems. By addressing these issues systematically, researchers and policymakers can contribute to a healthier environment and safeguard human health. Public education and policy can improve awareness and minimize plastic consumption, and disposal into the ocean.
5.3 Challenges and Recommendations [Ref: Cook Eclipse 1766]
Despite significant progress, microplastic research faces challenges such as data inconsistency and limited focus on deeper ocean layers. Variability in sampling methods and locations complicates data standardization, hindering accurate comparisons. Most studies prioritize surface waters, leaving gaps in understanding the dynamics of microplastics in deeper layers. To overcome these challenges, researchers should prioritize the standardization of methodologies, enhance monitoring efforts across various depths, and advocate for stricter regulations on plastic production and disposal.
By combining approaches from statistics and computation, with standardized protocols inspired by historical scientific practices, researchers can improve the reliability and comparability of microplastic datasets. This multifaceted approach can enhance our understanding of microplastic impacts, while ensuring that findings are robust and actionable, much like the legacy of Captain Cook’s contributions to global scientific standardization.
5.3.1 Standardization challenges in microplastic datasets [Ref: Nyadjro et al 2023, She et al 2022, Cross et al 2025]
The variability in sampling methods and locations presents significant challenges in standardizing datasets, which can hinder accurate comparisons of microplastic concentrations across studies. This issue is compounded by the limited research focus on deeper ocean layers, as most studies concentrate on surface waters, leaving a gap in understanding the vertical distribution of microplastics. While statistical measures like standard deviation can quantify variability within datasets, they do not address the root causes of inconsistency. Computational corrections, such as normalization techniques, can play a pivotal role in reducing variability. For instance, data normalization can adjust microplastic concentration values by accounting for differences in sampling protocols, such as converting particle counts to mass or standardizing concentrations per unit volume. Weighting factors can also be applied to balance datasets based on the depth of collection, ensuring that comparisons across studies are more equitable.
5.3.2 Statistical and Computation fixes for sampling artifact or non-standard microplastic datasets [Ref: Mpindi et al 2015, Levada 2020]
To address inconsistencies, researchers can draw inspiration from historical scientific efforts, such as Captain James Cook’s standardized data collection during the 18th-century global eclipse expeditions. Cook’s voyages emphasized uniformity in observational methods, enabling astronomers to compare eclipse timings across different locations with precision. Similarly, microplastic studies could benefit from adopting standardized sampling protocols, ensuring consistent methodologies for collection, processing, and analysis. For example, using uniform mesh sizes for particle collection and adhering to depth-stratified sampling designs can minimize variability and enhance comparability across studies. Statistical and computational methods further aid in addressing these challenges. Mixed-effects models, for instance, can account for both fixed effects (e.g., sampling depth) and random effects (e.g., study location), allowing researchers to isolate the influence of specific factors on microplastic distributions. Machine learning algorithms can analyze large datasets, identifying patterns and predicting concentrations at unmeasured depths. Techniques like PCA can be used to preprocess data for machine learning algorithms, reducing the number of variables and simplifying the dataset. Computational simulations, akin to Cook’s predictive mapping of celestial events, can model microplastic behavior across depths, incorporating environmental factors like currents and biological interactions to forecast distribution patterns.
5.3.3 When using statistical and computational fixes, its important to make sure real ecological differences are not removed as sampling artifact [Ref: Bertinetto et al 2020]
Moreover, distinguishing between actual ecological differences and artifacts caused by sampling variability requires robust statistical techniques. Depth stratification, multivariate analysis, and cross-validation can help identify true patterns in microplastic distribution. Depth profiling studies are used to examine how the concentration of a substance changes as you move vertically through a material or area. This is similar to looking at different layers of a cake to see how much frosting is in each layer. On the other hand, statistical comparisons, such as ANOVA (Analysis of Variance), are used to compare different groups to determine if there are significant differences between them. For instance, this method can help identify whether variations are due to regional differences or simply because of the depth at which the data was collected. Together, these methods help scientists and researchers understand changes and differences in their data more clearly.
6. References
Ref 1: Landrigan, P. J., Stegeman, J. J., Fleming, L. E., Allemand, D., Anderson, D. M., Backer, L. C., Brucker-Davis, F., Chevalier, N., Corra, L., Czerucka, D., Bottein, M. D., Demeneix, B., Depledge, M., Deheyn, D. D., Dorman, C. J., Fénichel, P., Fisher, S., Gaill, F., Galgani, F., Gaze, W. H., … Rampal, P. (2020). Human Health and Ocean Pollution. Annals of global health, 86(1), 151. https://doi.org/10.5334/aogh.2831
Ref 2: Li, W., & Meng, F. (2025). Microplastics in marine systems: A review of sources and sinks, typical environmental behaviors, and biological effects. Marine pollution bulletin, 214, 117758. https://doi.org/10.1016/j.marpolbul.2025.117758
Ref 3: Nyadjro, E. S., Webster, J. A. B., Boyer, T. P., Cebrian, J., Collazo, L., Kaltenberger, G., Larsen, K., Lau, Y. H., Mickle, P., Toft, T., & Wang, Z. (2023). The NOAA NCEI marine microplastics database. Scientific data, 10(1), 726. https://doi.org/10.1038/s41597-023-02632-y
Ref 4: She J, Buhhalko N, Lind K, Mishra A, Kikas V, Costa E, Gambardella C, Montarsolo A, Faimali M, Garaventa F and Lips I (2022) Uncertainty and Consistency Assessment in Multiple Microplastic Observation Datasets in the Baltic Sea. Front. Mar. Sci. 9:886357. https://doi.org/10.3389/fmars.2022.886357
Ref 5: Cross, R.K., Roberts, S.L., Jürgens, M.D. et al. Ensuring representative sample volume predictions in microplastic monitoring. Micropl.&Nanopl. 5, 5 (2025). https://doi.org/10.1186/s43591-024-00109-2
Ref 6: Martinez, K.M., Wilding, K., Llewellyn, T.R. et al. Evaluating the factors influencing accuracy, interpretability, and reproducibility in the use of machine learning classifiers in biology to enable standardization. Sci Rep 15, 16651 (2025). https://doi.org/10.1038/s41598-025-00245-6
Ref 7: Cook Eclipse, 1766 “On 5 August, Parker’s entry in the log was “Employed as before.” This bland entry belies what happened that day, which proved a momentous one for Cook. He knew that a solar eclipse would occur that day, and that southern Newfoundland was an ideal location from which to make observations. After several days of fog, conditions improved on the day of the eclipse, and Cook was able to make his observation. He wrote up his findings and sent a report to the Royal Society (see below), which was presented at one of their meetings by John Bevis in London in April 1767. It brought Cook to the attention of members of that body. The eclipse is now referred to as Cook’s Eclipse. The small island on which the observation was made, just south of Grandy Island, was given the name Eclipse Island.” https://www.captaincooksociety.com/cooks-voyages/early-voyages/newfoundland-voyages/july-september-1766 Original: Title: Captain Cook’s Journal During the First Voyage Round the World by James Cook https://www.gutenberg.org/files/8106/8106-h/8106-h.htm
Ref 8: Mpindi, J. P., Swapnil, P., Dmitrii, B., Jani, S., Saeed, K., Wennerberg, K., Aittokallio, T., Östling, P., & Kallioniemi, O. (2015). Impact of normalization methods on high-throughput screening data with high hit rates and drug testing with dose-response data. Bioinformatics (Oxford, England), 31(23), 3815–3821. https://doi.org/10.1093/bioinformatics/btv455
Ref 9: Alexandre L.M. Levada. (2020). Parametric PCA for unsupervised metric learning. Pattern Recognition Letters, 135, 425-430. https://doi.org/10.1016/j.patrec.2020.05.011
Ref 10: Bertinetto, B., Engel, J, Jansen, J. (2020). ANOVA simultaneous component analysis: A tutorial review. Analytica Chimica Acta: X, 6, 100061. https://doi.org/10.1016/j.acax.2020.100061